
Mini-Series: Let’s learn from Communication Theory
Uncover the hidden power of communication theories on information dashboard design in this Mini-Series.
The treasury of communication theories has a fascinating concept called the “framing effect.” This idea, pioneered by sociologist Erving Goffman, explores how people’s perceptions and judgments are influenced by how information is presented. Understanding the framing effect can significantly benefit the design of dashboards. It reminds us of the importance of tailoring information best to meet the audience’s information needs and motivations to use the dashboard. Get the framing right even before you start looking at the data. Then, it’s almost impossible to fail.
Understanding the Framing Effect
The framing effect is based on the notion that individuals interpret information differently depending on its presentation. Goffman suggests that individuals construct meaning from their social interactions by relying on specific frames, which are mental structures that shape their understanding of a situation. These frames help people categorise, interpret, and make sense of the world around them.
Applying the Framing Effect to Dashboard Design
Dashboard design ensures that the presented information effectively communicates with the audience. By considering the framing effect, developers craft dashboards that resonate with the intended users and fulfil their information needs. Here’s how the framing effect can be adapted to dashboard design:
Understanding the Audience
Before designing a dashboard, it is essential to identify and understand the target audience. Different groups of users may have varying needs, motivations, and levels of expertise. By understanding their characteristics, such as their roles, responsibilities, and familiarity with the subject matter, developers know how to tailor the dashboard’s framing to meet their expectations.
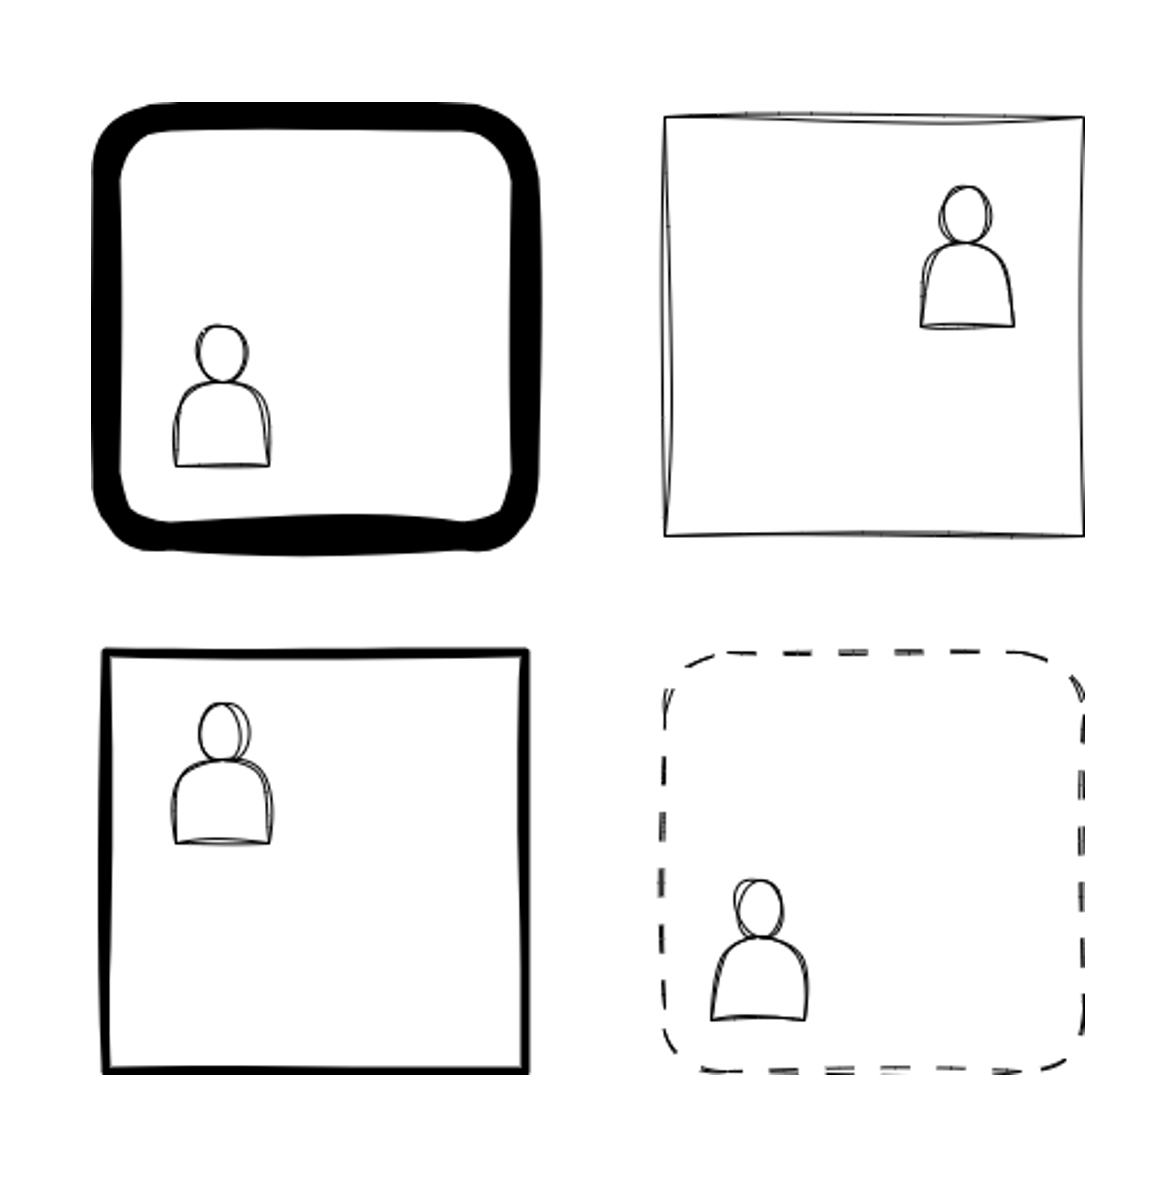
Choosing the Right Frame
Once the audience is identified, developers select the appropriate frame for the dashboard. The structure aligns with the users’ mental models and expectations. As a result, it’s much easier for the audience to interpret and navigate the information presented. For example, if the audience consists of executives who require high-level insights, the frame focuses on strategic overviews and key performance indicators defined by subject-matter experts.
Highlighting the Relevant Information
The framing effect suggests that people are more likely to pay attention to and remember information highlighted or presented prominently. Visual cues like colour developers direct the users’ attention towards the most critical data points. Of course, it’s hard to highlight using a colour if more than two colours are already present in your dashboard.
Providing the Appropriate Context
Context is essential for users to make informed decisions based on the dashboard’s information. Developers consider incorporating contextual information, such as trends, benchmarks, or historical data, to enhance the audience’s understanding and interpretation. With this additional context, users easily evaluate the significance and implications of the data presented.
Giving the Needed Flexibility
Every user has unique preferences and information needs. To accommodate this, developers provide customisation options within the dashboard, allowing users to personalise their views and select the most relevant information. This empowers individuals to frame the dashboard according to their specific requirements, enhancing their overall experience and engagement.
Concluding the Main Learnings
We create more intuitive and impactful visualisations by incorporating the framing effect into the dashboard design. Understanding the target audience, choosing appropriate frames, highlighting relevant information, providing context, and allowing customisation are all critical considerations in optimising dashboards. By leveraging the power of framing, we can ensure that dashboards effectively communicate information, empower users, and support better decision-making processes.