
Mini-Series: Let’s learn from Communication Theory
Uncover the hidden power of communication theories on information dashboard design and data analytics in this Mini-Series.
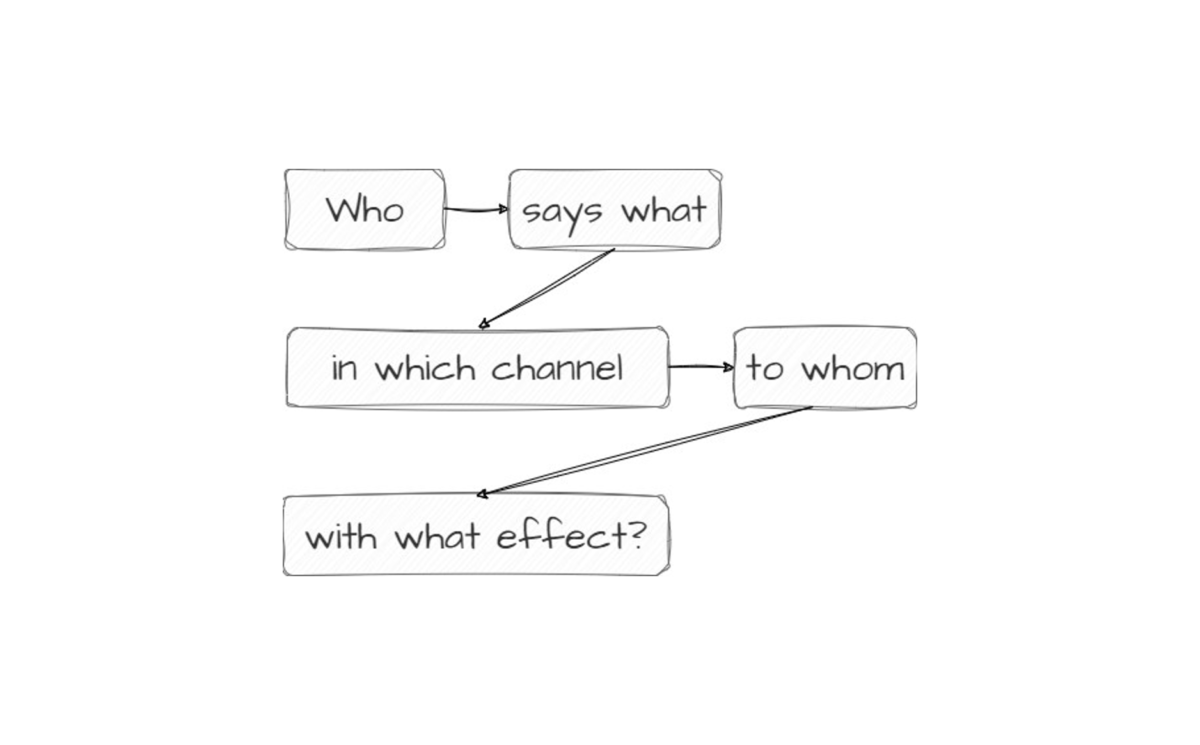
The Lasswell Formula provides a robust framework for effective communication. Developed by Harold D. Lasswell, this formula highlights the importance of answering fundamental questions: “Who says what, in which channel, to whom, with what effect?” This blog post will explore how the Lasswell Formula applies to information dashboards, emphasizing the significant role of the “with what effect” component. We’ll discuss how this empowers users to resonate, relate, or reject the message and make informed decisions.
Understanding the Lasswell Formula
The Lasswell Formula poses a series of questions that encapsulate the essential elements of one-directional communication:
- Who says what: Identifies the sender of the message and the content being communicated.
- In which channel: Refers to the medium or platform through which the message is delivered.
- To whom: Identifies the intended audience or recipients of the message.
- With what effect: Focuses on the impact or desired outcome of the communication.
Applying the Lasswell Formula to Information Dashboard Design
In the context of information dashboards, we can use the Lasswell Formula to optimize the communication process and empower users in the following ways:
Who says what: Dashboard Design and content selection
The “Who says what” component involves carefully considering who is developing the dashboard and what information is being presented. Individuals or teams with expertise in data visualisation and domain knowledge should create dashboards. Or if the developer does not have the domain knowledge, she or he might team up with someone who does. The content displayed should be relevant, accurate, and aligned with the specific goals and needs of the intended audience and the intended message.
In which channel: Dashboard Medium and Delivery
The “In which channel” aspect relates to the choice of medium for presenting the dashboard. It could be a web-based interface, a mobile app, or a physical display. Select the channel based on the accessibility and preferences of the target audience. Ensure ease of use of the design, intuitive navigation, and responsive functionality across different devices or for a specific medium.
To whom: Tailoring the Dashboard for the Audience
The “To whom” component emphasizes the importance of understanding the target audience. Tailor information dashboards to the users’ specific needs, roles, and knowledge levels. This includes selecting relevant metrics, visualisations, and interactivity options that align with their interests and decision-making requirements.
With what effect: Impact and User Empowerment
The “With what effect” aspect empowers users and facilitates informed decision-making. Dashboards must aim to create an intended effect or impact, enabling users to monitor performance, identify trends, and take appropriate actions. Call-to-action elements within the dashboard, such as filters, drill-down options, or alert mechanisms, enhance user engagement and enable them to respond effectively to the presented information.
User’s Choice: Resonate, Relate, or Reject
An essential aspect of the Lasswell formula is recognizing that a dashboard user has the autonomy to resonate, relate, or reject the message presented. While the design and content aim to deliver a specific effect, users can interpret the information, apply their expertise, and make decisions based on their unique context. The dashboard serves as a tool to support their decision-making process, providing valuable insights and recommendations while respecting their perspective and judgment.
Concluding the Main Learnings
The Lasswell Formula provides a valuable framework for information dashboard design, emphasizing the significance of the “with what effect” component. By carefully considering the sender, content, channel, and intended audience, designers can create impactful dashboards that empower users to make informed decisions. However, it is essential to remember that users have the right to interpret the insights to an extent to even reject them as irrelevant or invalid in a given context.